Optimice el rendimiento de su tienda con informes de clasificación de ubicación
Optimice el rendimiento de las tiendas con los informes de clasificación de ubicaciones. Analice métricas clave para mejorar la eficiencia. Ideal para pequeños minoristas con cinco tiendas o menos.
Table of Contents
Descripción general
El informe "Ranking de ubicaciones" es una herramienta esencial para las empresas que buscan evaluar y comparar el rendimiento de diferentes ubicaciones dentro de su red. Este informe proporciona información sobre métricas de rendimiento clave, lo que permite a los responsables de la toma de decisiones identificar las ubicaciones con mejor rendimiento y aquellas que necesitan mejoras.
Características principales
- Métricas de rendimiento: analice las ubicaciones en función de diversas métricas, como ventas, tráfico, tasas de conversión y eficiencia del personal.
- Criterios personalizables: adapte los criterios de clasificación para centrarse en las métricas más relevantes para sus objetivos comerciales.
Ejemplo de informe
Casos de uso
Caso de uso 1: Optimización de la cadena minorista
Una cadena minorista con múltiples sucursales utiliza el informe "Ranking de ubicaciones" para identificar sus tiendas con mejor desempeño. Al analizar los datos de ventas y tráfico peatonal, el equipo de administración descubre que las tiendas en áreas urbanas tienen un mejor desempeño que las de áreas rurales. Esta información los impulsa a asignar más recursos de marketing a las ubicaciones con un desempeño inferior y optimizar la distribución del inventario en función del desempeño regional.
Caso de uso 2: Evaluación del desempeño de una pequeña boutique
El propietario de una pequeña boutique con cinco tiendas utiliza el informe "Ranking of Locations" para evaluar el rendimiento de cada una de ellas. Al centrarse en los datos de tráfico de clientes y ventas, el propietario identifica qué ubicaciones destacan y cuáles están rezagadas. Esta información ayuda al propietario a adaptar las estrategias de marketing y las promociones para impulsar el rendimiento de las tiendas de bajo rendimiento y replicar las tácticas exitosas en todas las ubicaciones.
Caso de uso 3: Eficiencia en la dotación de personal estacional
Una pequeña cadena de tiendas especializadas utiliza el informe "Ranking of Locations" para evaluar la eficiencia de la dotación de personal durante las temporadas altas. Al comparar las horas trabajadas por el personal con los datos de ventas y tráfico, el dueño de la tienda identifica qué ubicaciones tienen exceso o falta de personal. Este análisis ayuda a optimizar los horarios del personal, lo que garantiza que cada tienda tenga la cantidad adecuada de empleados durante los períodos de mayor actividad, mejorando así el servicio al cliente y reduciendo los costos laborales.
Beneficios
- Toma de decisiones mejorada: tome decisiones informadas basadas en datos de rendimiento completos.
- Asignación de recursos: asigne recursos de manera eficiente a las ubicaciones donde más se necesitan.
- Mejora del rendimiento: identificar las mejores prácticas de los mejores empleados e implementarlas en otras ubicaciones.
El informe "Ranking de ubicaciones" es una herramienta poderosa que permite a las empresas maximizar su potencial aprovechando información basada en datos. El uso regular de este informe puede generar mejoras significativas en la eficiencia operativa y el rendimiento general.
Pasos
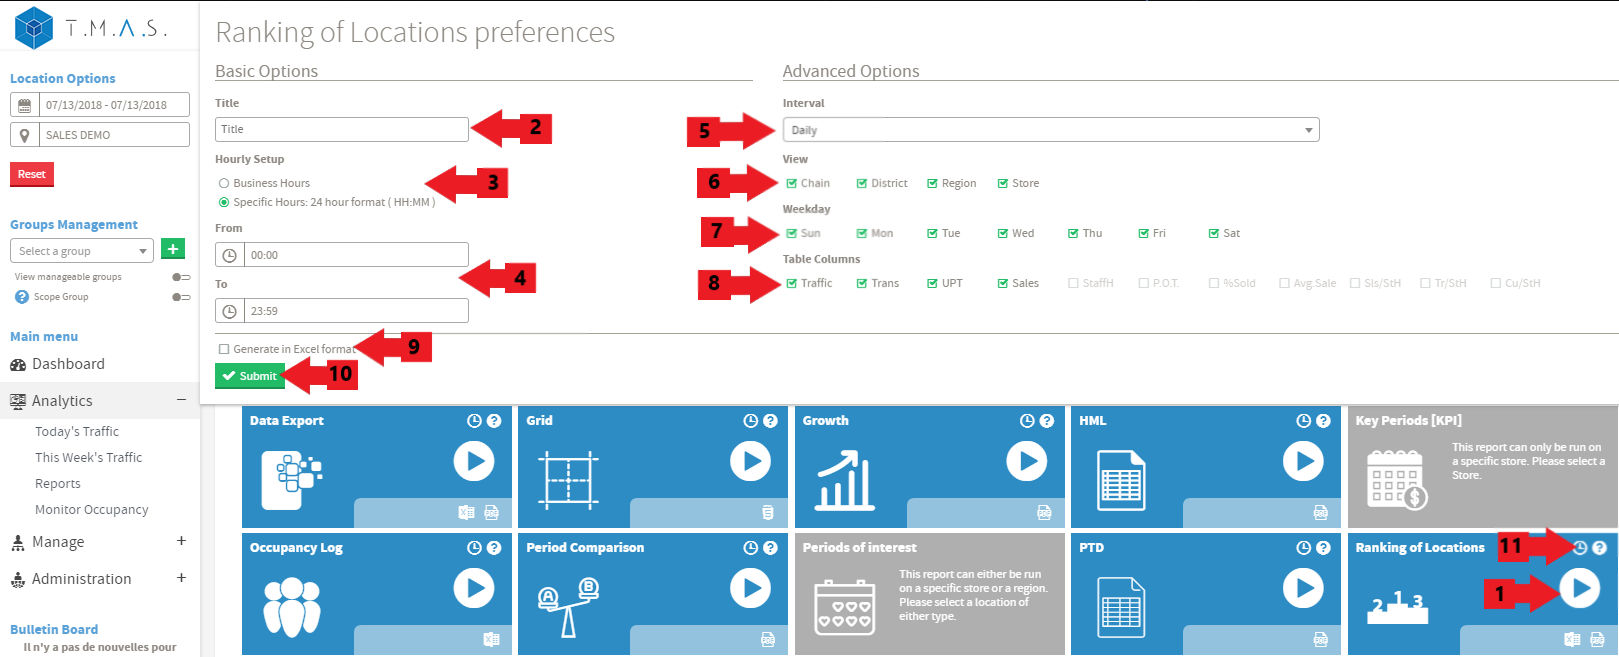
Es necesario seleccionar una Cadena, Distrito o Región para poder acceder al informe de generación.


Asumiremos que ha elegido la ubicación y la fecha que desea incluir en los informes.
- Seleccione el informe de clasificación por ubicación.
- Hay un mensaje que indica que esta es una versión gratuita limitada a menos que tenga una licencia;
- (opcional) Ingrese el nombre del título de su elección
- Haga clic en Horario comercial u Horario específico e ingréselo si está seleccionado;
- Seleccione qué intervalo desea mostrar en el informe;
- Seleccione en qué nivel desea ver el informe;
- Seleccione qué días de la semana se mostrarán en el informe;
- Seleccione qué columnas desea incluir en el informe;
- Seleccione la opción deseada según sea necesario;
- Haga clic en Enviar;
- Haga clic en Programar si desea automatizarlo (consulte Programación de informes para obtener más detalles)
Preguntas frecuentes
| P: ¿De dónde proviene el código de la columna Loc/Tienda? |
|
R: Es el número de identificación de la ubicación con cualquier 0 agregado eliminado y el código de estado o provincia de la dirección de la ubicación. Ejemplo de Administrar ubicaciones  ¿Integración activa con POS o importación de ventas?No modifique el ID de ubicación en la administración de ubicaciones, ya que provocará una interrupción en cualquier integración activa donde el ID de ubicación se use como referencia o clave coincidente con cualquier importación. |
